
Kennis /
Analyzing Culture in the 21st century
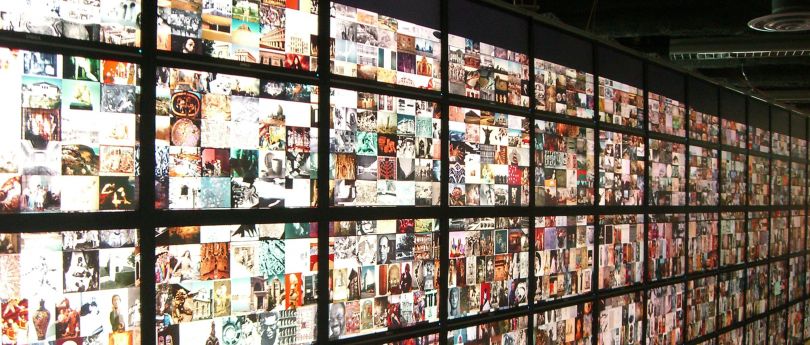
Cultural Analytics interface designs @ HIPerWall visual supercomputer | 205 megapixels | Calit2-Irvine | Presented: May 2008.
— Interview with Lev Manovich for Archive 2020, by Niels Kerssens and Annet Dekker.
What is Cultural Analytics and what are its origins?
We are living through an exponential explosion in the amounts of data we are generating, capturing, analyzing, visualizing, and storing – including cultural content.
Because of digitization efforts since the middle of the 1990s, and because the significant (and constantly growing) percentage of all cultural and social activities passes through, or takes place on the web or networked media devices (mobile phones, game platforms, etc.), we now have access to unprecedented amounts of both ‘cultural data’ (cultural artefacts themselves), and ‘data about culture’.
A significant part of the available media
content in digital form was originally created in electronic or physical
media and has been digitized. We can call such content ‘born analog’.
But we also now find online massive amounts of ‘born digital’ content
(photography, video, music) which until the advent of ‘social media’
was not intended to be seen by people worldwide – but which now ends up
online at social media sites (Flickr, YouTube, etc.)
Together
with the researchers and students working in our lab, we have been
developing a new paradigm for the study, teaching and public
presentation of these cultural artefacts, their dynamics, and flows. We
call this paradigm Cultural Analytics. The key idea of Cultural
Analytics is the use of computers to automatically analyze cultural
artefacts in visual media, extracting large numbers of features that
characterize their structure and content. For example, in the case of a
visual image, we can analyze its greyscale and color characteristics,
orientations of lines, texture, composition, and so on. Therefore, we
can also use another term to refer to our research method – Quantitative
Cultural Analysis (QCA).
Cultural Analytics is thinkable and possible because of three developments: the aforementioned digitization of cultural assets and the rise of web and social media; work in computer science; and the rise of a number of fields which use computers to create new ways of representing and interacting with data. The two related fields of computer science - image processing and computer vision - provide us with the variety of techniques to automatically analyze visual media. The fields of science visualization, information visualization, media design, and digital art provide us with the techniques to visually represent patterns in data and interactively explore this data.
Today science, business, governments and other agencies rely on computer-based analysis and visualization of large data sets and data flows. They employ statistical data analysis, data mining, information visualization, scientific visualization, visual analytics, and simulation.
If we are interested in analyzing cultural patterns in other media besides text and sound, and also in asking larger theoretical questions about cultures (as opposed to more narrow pragmatic questions asked the professional fields mentioned above), we need to adopt a broader perspective. Firstly, we need to develop techniques to analyze and visualize the patterns in different forms of cultural media - movies, cartoons, motion graphics, photography, video games, websites, product and graphic design, architecture, etc. Second, while we can certainly take advantage of the ‘web native’ cultural content, we should also work with other categories that I listed above (‘digitized artefacts which originated in other media’; ‘cultural experiences.’) Thirdly, we should be self-reflective. We need to think about the consequences of thinking of culture as data and of computers as the analytical tools: what is left outside, what types of analysis and questions get privileged, and so on. This self-reflection should be part of any Cultural Analytics study. These three points guide our Cultural Analytics research.
Will
Cultural Analytics change our understanding of culture and the way in
which we research it - and possibly even history as we know it? The
exponential growth of a number of both non-professional media producers
in the 2000s has led to a fundamentally new cultural situation and a
challenge to our normal ways of tracking and studying culture.
The
ubiquity of computers, digital media software, consumer electronics,
and computer networks led to the exponential rise in the numbers of
cultural agents worldwide and the media they create – making it very
difficult, if not impossible, to understand global cultural developments
and dynamics in any substantial details using our 20th-century
theoretical tools and methods. But what if can we use the same
developments – computers, software, and availability of massive amounts
of 'born digital' cultural content – to track global cultures in ways
impossible with traditional tools?
Before, cultural theorists and historians could generate theories and histories based on small data sets (for instance, ‘classical Hollywood cinema’, ‘Italian Renaissance’, etc.) But how can we track ‘global digital cultures’, with their billions of cultural objects, and hundreds of millions of contributors? Before you could write about culture by following what was going on in a small number of world capitals and schools. But how can we follow the developments in tens of thousands of cities and educational institutions?
For some time now literary scholars have been using statistical techniques to explore patterns in literary texts - but not other media. Our focus is on using image processing and computer vision for automatic analysis of visual media in the humanities context. This is what separates Cultural Analytics from 20th-century humanities disciplines that focus on visual media (art history, film studies, cultural studies) and also 20th-century paradigms for quantitative media research developed within social sciences. Similarly, while artists, designers and computer scientists have already created a number of projects to visualize cultural media, the existing projects that I am aware of rely on existing metadata such as Flickr community-contributed tags. In other words, they use information about visual media – creation date, author name, tags, favourites, location information, etc. – and do not analyze the media itself.
In contrast, Cultural Analytics uses image processing and computer vision techniques to automatically analyze large sets of visual cultural objects to generate numerical descriptions of their structure and content. These numerical descriptions can be then graphed and also analyzed statistically.
We believe that a systematic use of large-scale computational analysis and interactive visualization of cultural patterns will become a major trend in cultural criticism and culture industries in the coming decades. What will happen when humanists start using interactive visualizations as a standard tool in their work, the way many scientists do already? If slides made possible art history, and if a movie projector and video recorder enabled film studies, what new cultural disciplines may emerge out of the use of interactive visualization and data analysis of large cultural data sets?
So where it certainly will change our understanding of culture and the way we research it, Cultural Analytics may also change history as we know it. But here is a problem for Cultural Analytics, as it has the potential to map everything that remains outside the canon – to begin generating ‘art history without great names’. We want to understand not only the exceptional but also the typical; not only the few ‘cultural sentences spoken by a few ‘great man’ but the patterns in all cultural sentences spoken by everybody else; in short, what is outside a few great museums rather than what is inside and what has been already extensively discussed too many times. To do this, we will need as much of previous culture in digital form as possible. However, what is digitally available is surprisingly little.
What direction do you see Cultural Analytics taking in the future?
One
of the directions we are planning to pursue in the future is the
development of visual systems that would allow us to follow global
cultural dynamics in real-time. Imagine a real-time traffic display (la
car navigation systems) – except that the display is wall-size, the
resolution is thousands of times greater, and the traffic shown is not
cars on highways, but real-time cultural flows around the world. Imagine
the same wall-sized display divided into multiple windows, each showing
different real-time and historical data about cultural, social, and
economic news and trends – thus providing a situational awareness for
cultural analysts. Imagine the same wall-sized display playing an
animation of what looks like an earthquake simulation produced on a
super-computer – except in this case the “earthquake” is the release of a
new version of popular software, the announcement of an important
architectural project, or any other important cultural event.
What we are seeing are the effects of such “cultural earthquake” over time and space. Imagine a wall-sized computer graphic showing the long tail of cultural production that allows you to zoom to see each individual product together with rich data about it (a la real estate map on zillow.com) – while the graph is constantly updated in real-time by pulling data from the web. Imagine a visualization that shows how other people around the word remix new videos created in a fan community, or how a new design software gradually affects the kinds of forms being imagined today (the way Alias and Maya led to a new language in architecture).
These are the kinds of tools we want to create to enable new type of cultural criticism and analysis appropriate for the era of cultural globalization and user-generated media: three hundred digital art departments in China alone; approximately 10,000 new users uploading their professional design portfolios on coroflort.com every month; billions of blogs, user-generated photographs and videos; and other cultural expressions which are similarly now created at a scale unthinkable only ten years ago.
For further information about the Software Studies Initiative and their projects visit Softwarestudies.com
Share
Gerelateerde thema's
Interessante ontwikkelingen die organisatiebreed worden behandeld.